Research Report
Read the Report, Analysis, and Responses layers — from headline conclusions down to raw individual answers.
Once complete, iMario generates a structured report. Each section serves a different purpose — and the most useful analysis moves through all of them.
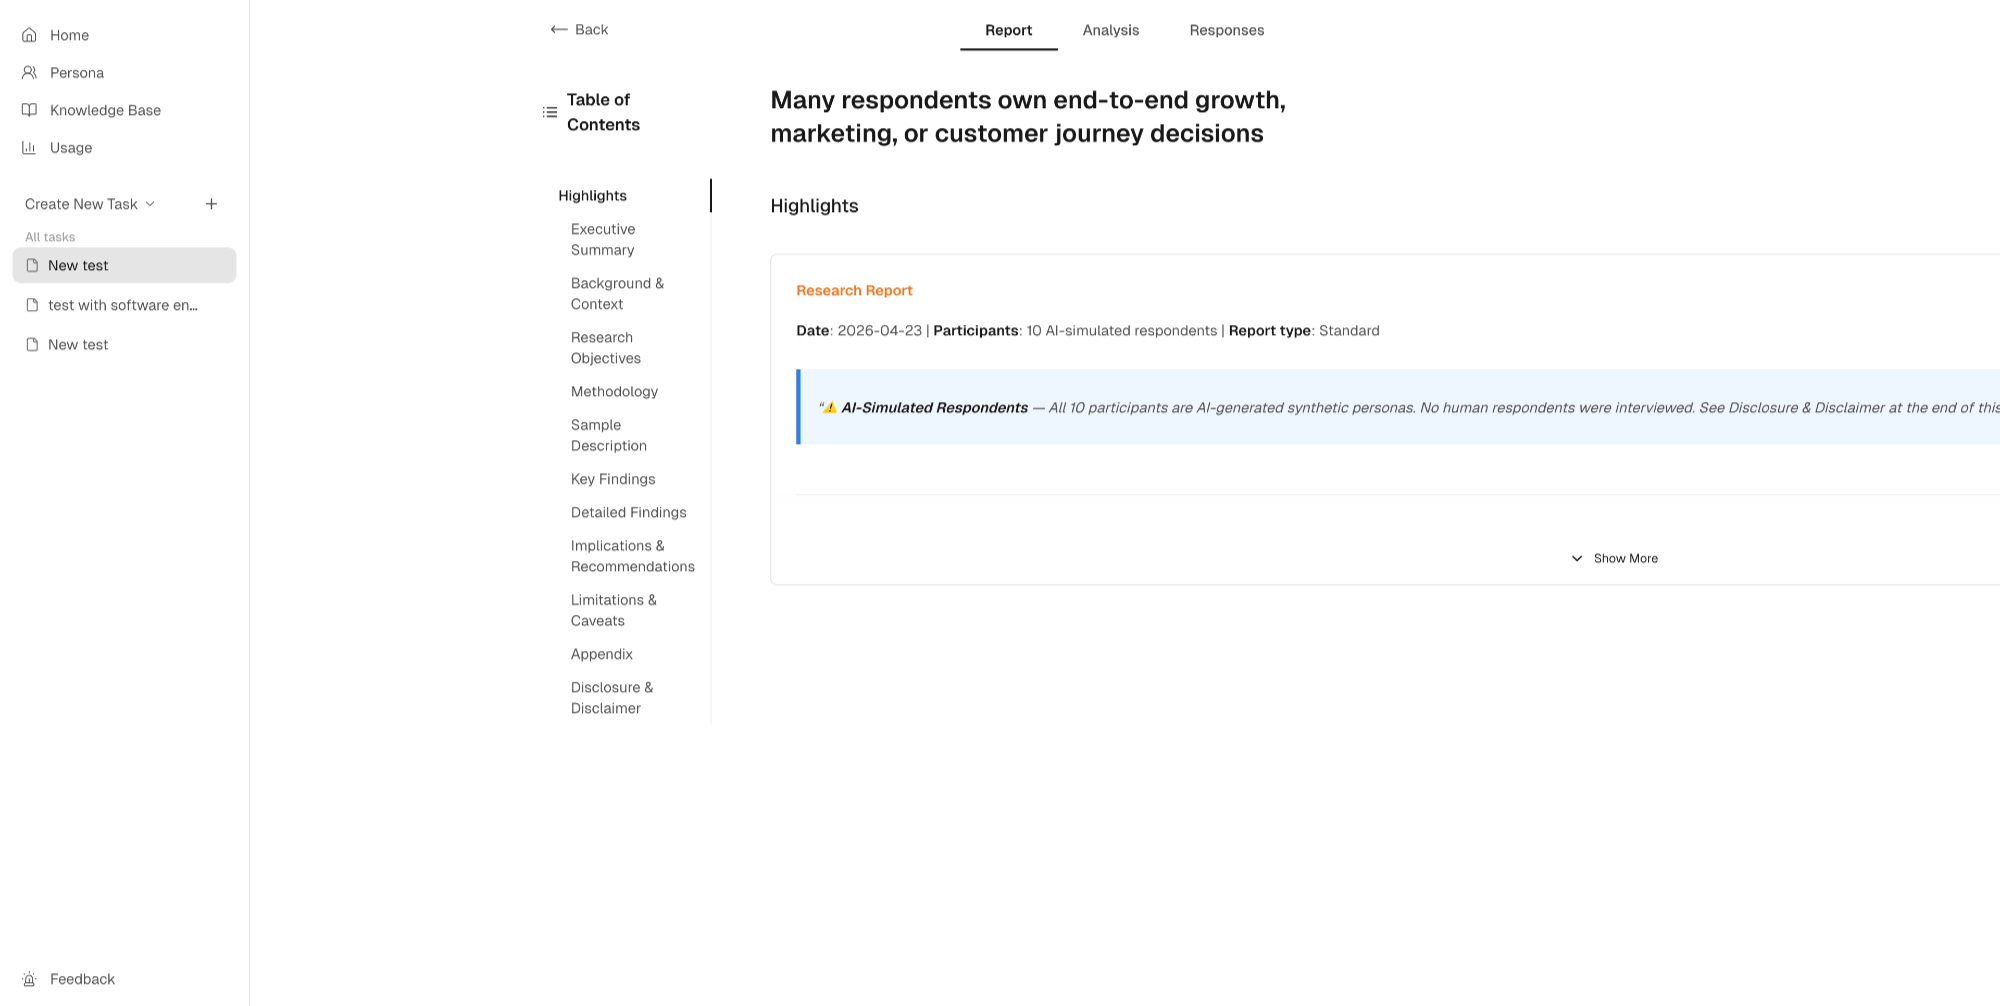
Research Report
Start here. The Report layer gives you the big picture — what the task found, at a glance.
Executive Summary The fastest path to the finding. Read this first to orient yourself, and share it with stakeholders who need the conclusion without the full detail.
Background & Context The setup for the research — what prompted the task and the conditions it was run under. Useful for anyone coming to the report cold, and important for your own record-keeping when you return to findings weeks later.
Research Objectives What the task was designed to answer. Check this before reading the findings — it keeps you honest about whether the results actually address the original question, or whether the task drifted.
Methodology How the simulations were structured and run. Relevant if you're pressure-testing the findings or need to explain to a stakeholder how the research was conducted.
Sample Description Who your synthetic individuals were — their profiles, backgrounds, and defining traits. If findings surprise you, this is the first place to look. Unexpected results are often explained by who was in the room.
Key Findings The headline conclusions. What the task found, stated plainly. Use this to decide where to focus your attention in the sections that follow.
Detailed Findings The full picture behind each key finding — individual responses, behavioral patterns, and the evidence that supports each conclusion. This is the analytical core of the report.
Go here when you need to understand not just what people said, but why — and when you need to verify that a summary-level finding holds up under scrutiny.
Implications & Recommendations What the findings mean for your next decision. iMario translates research outputs into directional guidance — what to pursue, what to reconsider, and where more investigation is warranted.
This is the section most people skip and most people should read first after the Key Findings.
Limitations & Caveats What the research can and can't tell you. Every task has constraints — audience size, brief specificity, content framing — and this section makes them explicit.
Read this before presenting findings to stakeholders. Knowing the boundaries of your research is as important as knowing the findings themselves.
Appendix Supporting data, raw response logs, and additional detail for anyone who wants to go deeper than the main report.
Disclosure & Disclaimer Standard information about the nature of synthetic research and how findings should be interpreted. Important context for any external use of the report.
Use this to orient yourself before going deeper. If you're sharing results with someone who doesn't need the full detail, this is the layer to share.
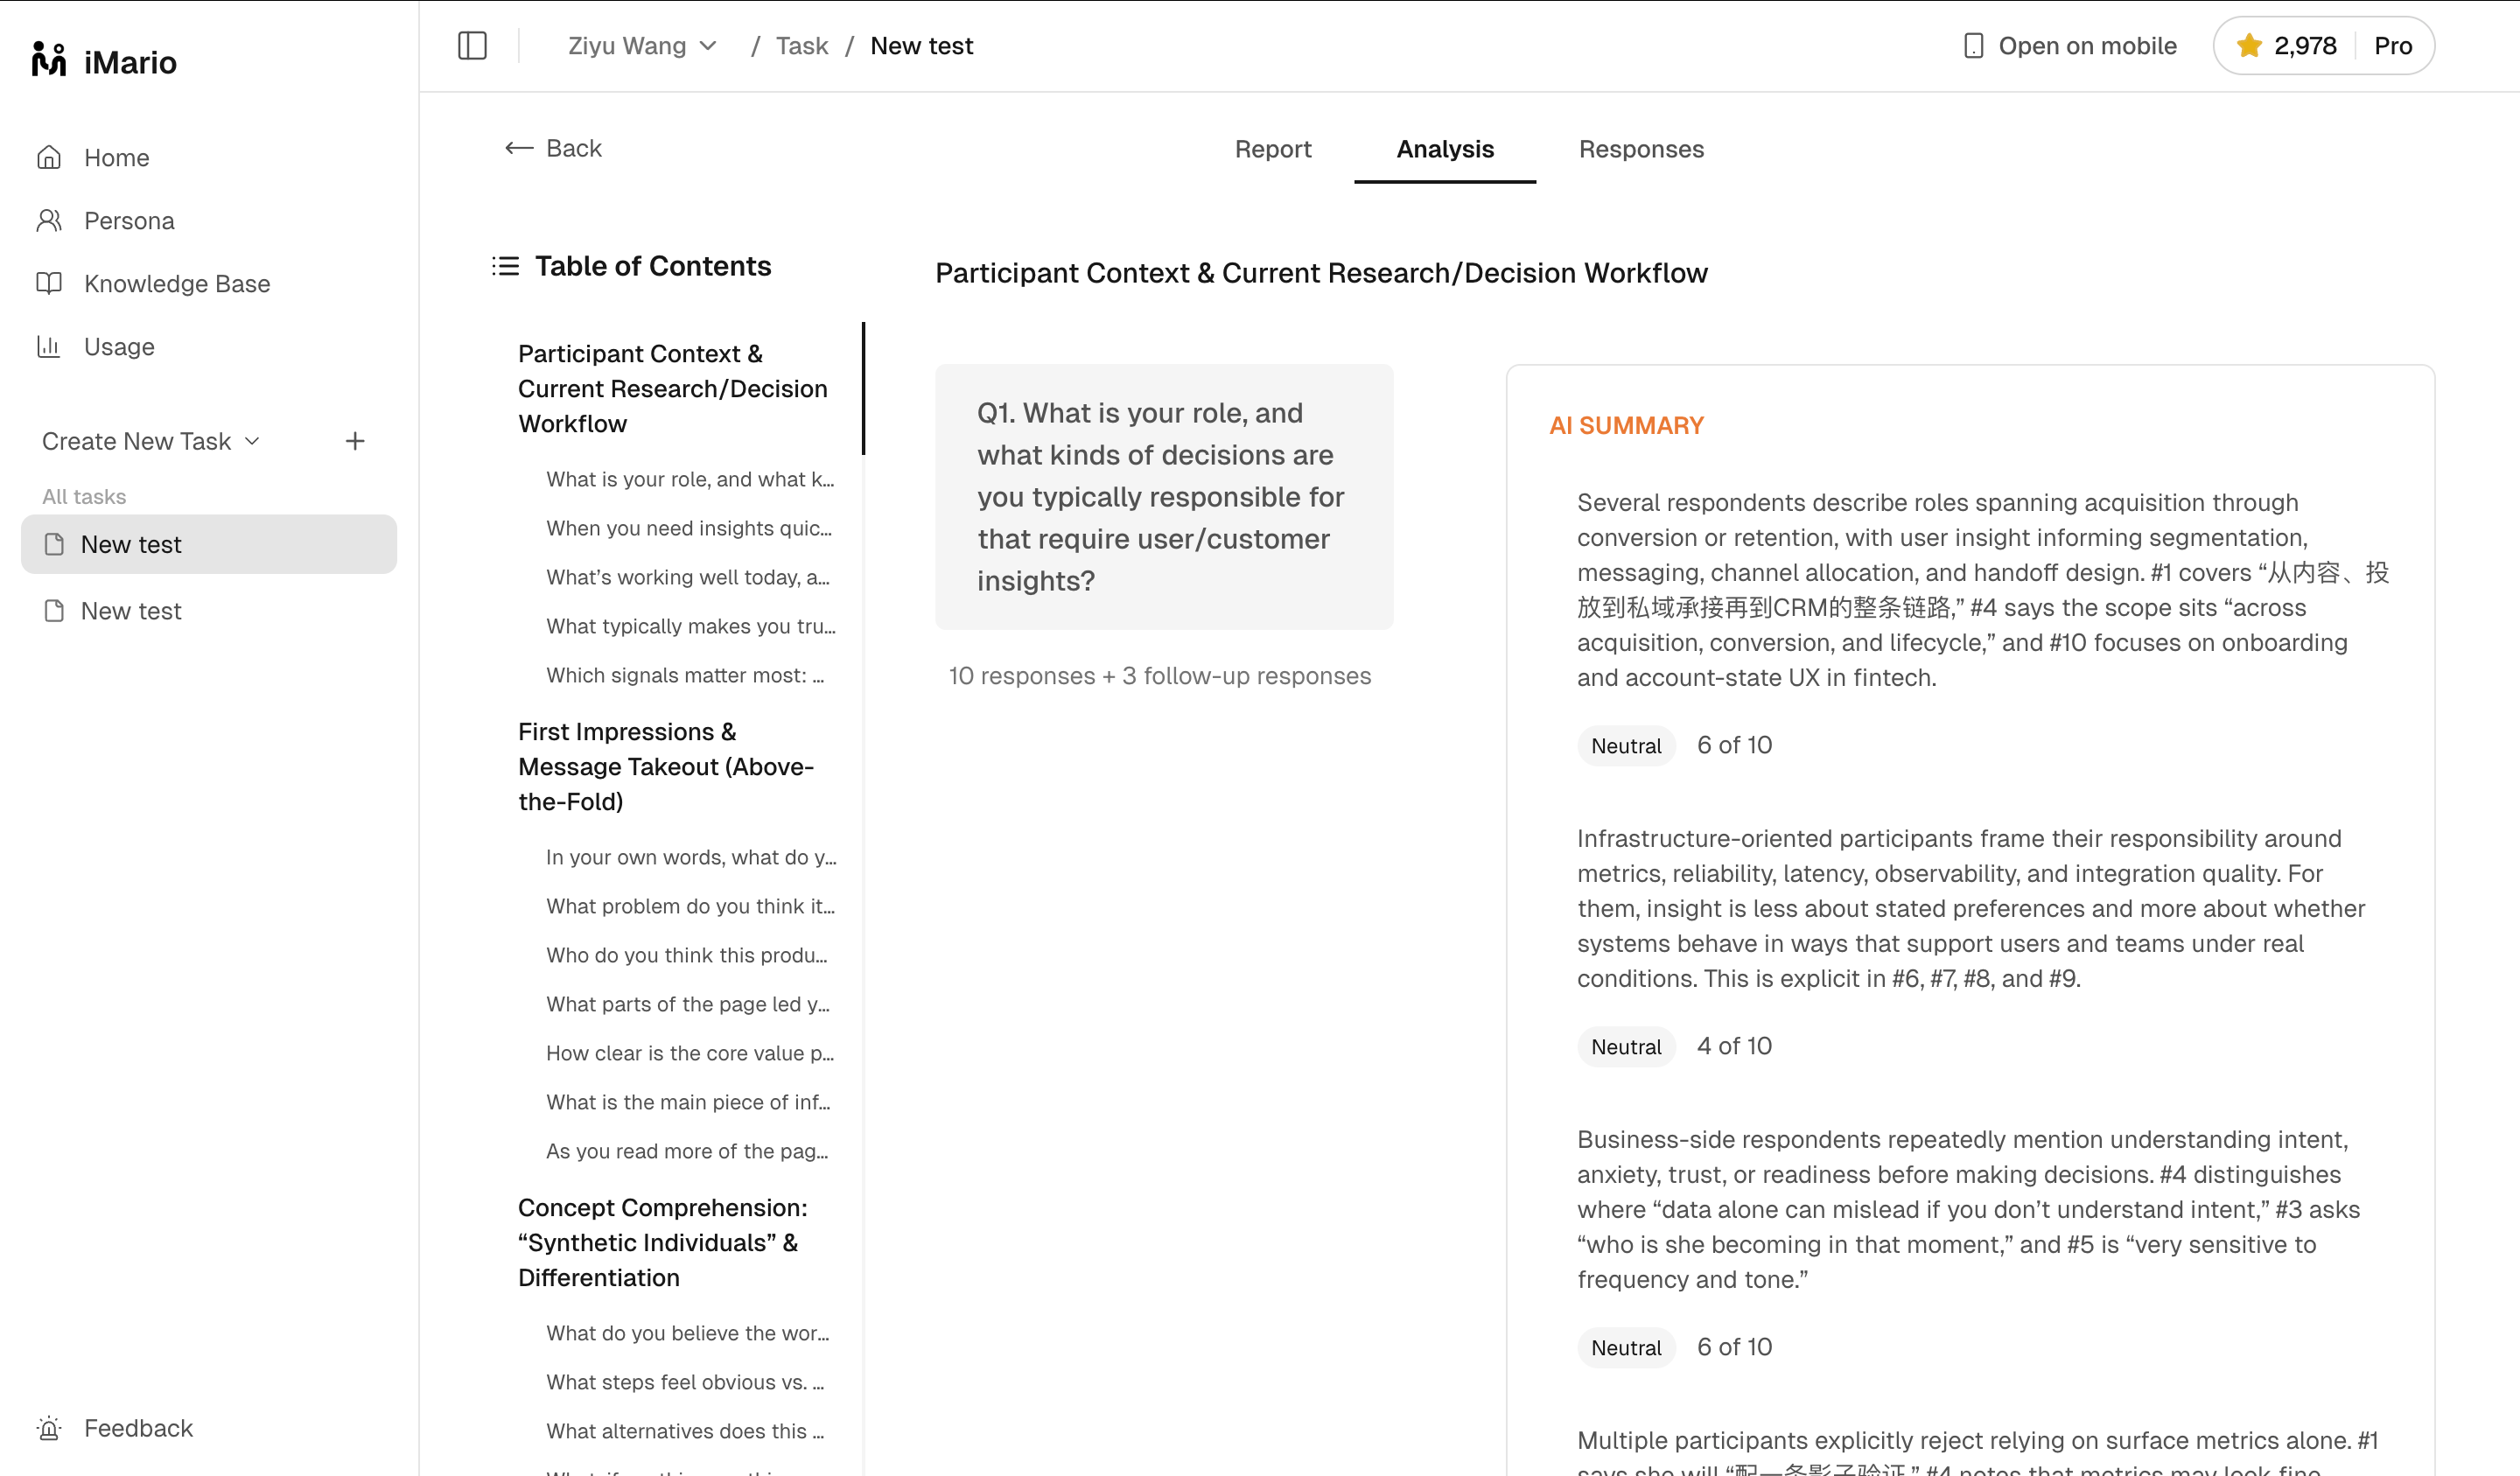
Analysis
The Analysis layer breaks results down question by question — giving you a structured read of how your synthetic individuals responded across every part of your Discussion Guide.
For each question, you'll see:
- AI Summary — a synthesized interpretation of how individuals responded, including points of agreement, divergence, and notable patterns. Each summary includes a sentiment signal (Neutral, Mixed, Positive, etc.) and a count of how many individuals it applies to — so you know at a glance whether a finding is representative or an edge case.
- Response count — how many primary responses and follow-up responses were generated for that question, giving you a sense of depth before you read the detail.
At the bottom of each question, Dimensional Analysis gives you three additional cuts of the data:
- Sentiment Analysis — how individuals felt about the topic, broken down by emotional valence across the group
- Demographic Breakdown — how responses varied across different individual profiles and backgrounds
- Language Patterns — recurring words, phrases, and framing choices that reveal how your audience naturally talks about the topic
The left-hand Table of Contents organizes questions by the section structure of your Discussion Guide — making it easy to navigate a long analysis without losing context. Sections reflect the logical arc of your research: from participant context, to first impressions, to concept comprehension, and beyond.
Start with the AI Summaries to get the shape of the findings. Then use Dimensional Analysis to understand who is driving each pattern — and why it might differ across your audience.
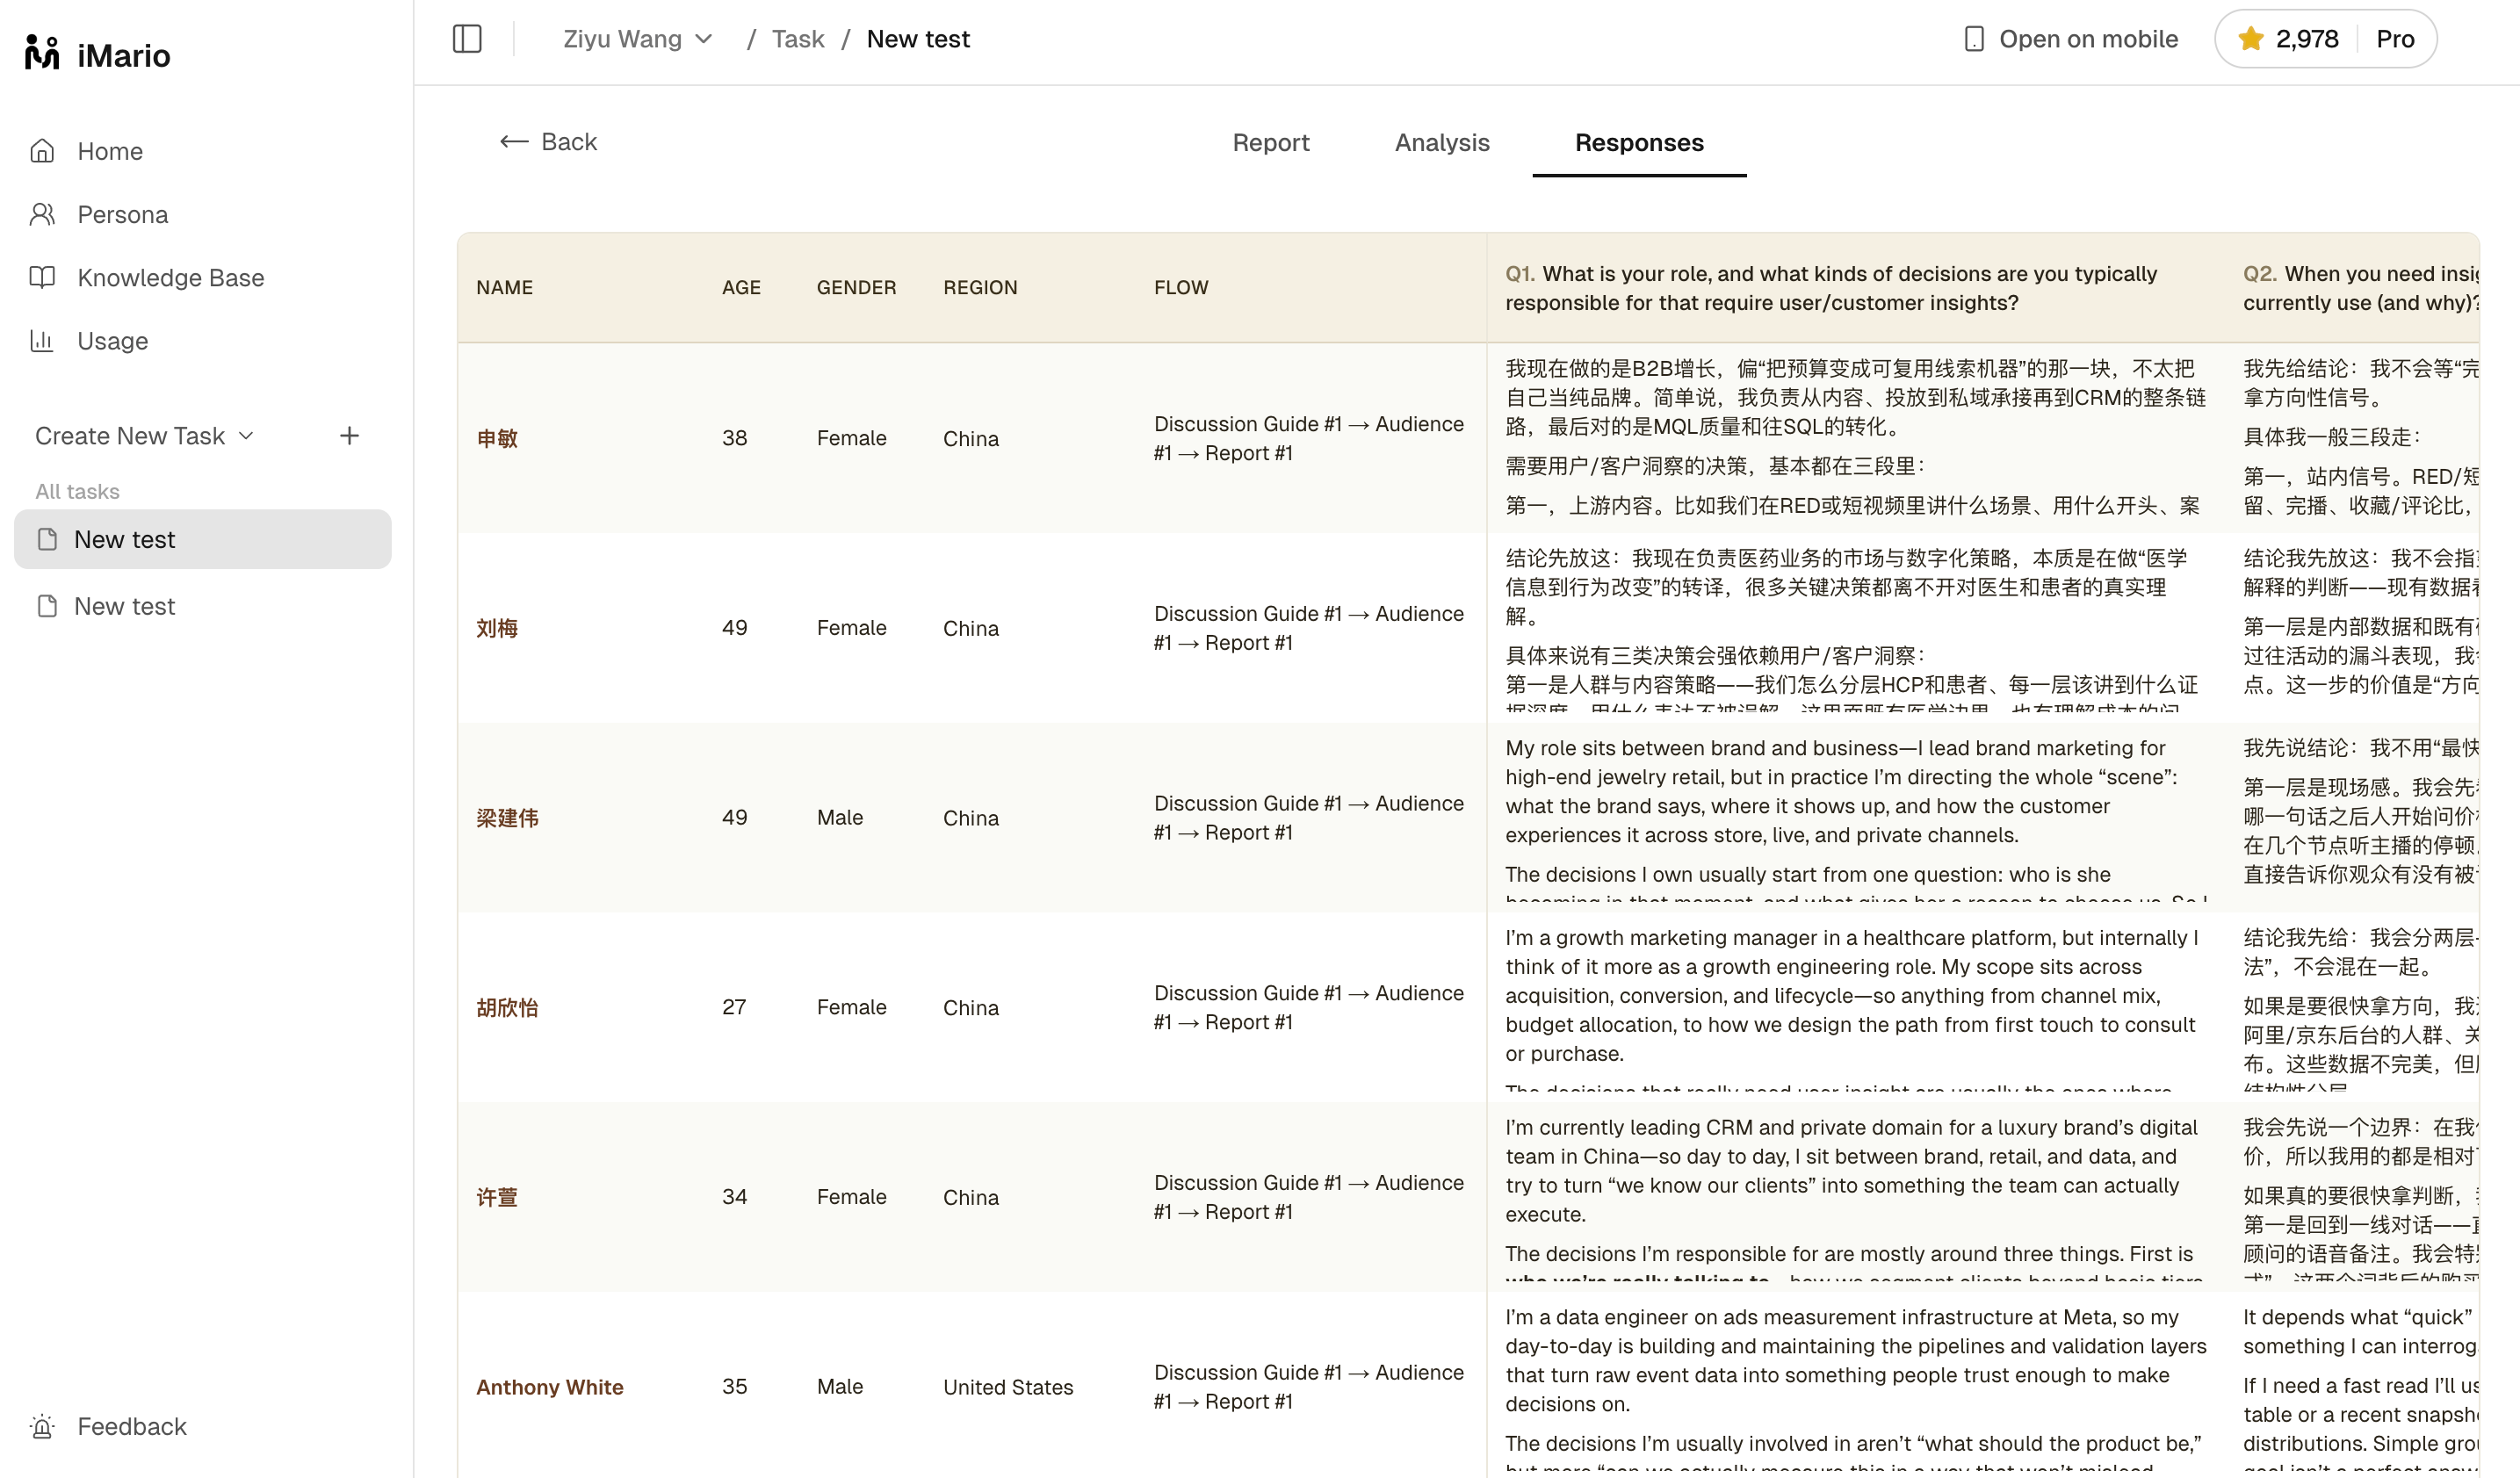
Responses
Raw outputs from each synthetic individual. This is the primary source — everything in the Report and Analysis layers is derived from here.
- Review individual answers
- Compare perspectives side by side
- Trace how conclusions were formed
Go here when you want to verify a finding, understand the reasoning behind a pattern, or find a quote that captures a perspective precisely. Reading raw responses also keeps you honest — summaries compress, and compression loses nuance.