Output
Configure the Report node — pick Research Report or Quick Test Report and tune length, depth, and dimensions.
The report type you choose shapes not just how results are presented — but what kind of thinking the task is optimized for. Choosing the wrong type doesn't mean you get bad data. It means you get the right data in the wrong format for the decision you're trying to make.
iMario has two report types. Choose based on what you're testing and what you need to do with the findings.
Research Report
Use this when the finding itself needs to be defensible — when you're making a significant decision, presenting to stakeholders, or trying to understand not just what people think but why. Best paired with a Discussion Guide.
Research Reports take longer to generate and are designed to be read carefully. They surface contradictions, edge cases, and behavioral patterns that a lightweight summary would flatten.
To configure your Research Report Node:
- Click Report #1 on the Task Canvas to open the configuration panel
- Set your Output Options — Template, Language, and Format (PDF, Markdown, or PPT)
- Under Advanced Settings, configure the options below
Report Length
- Executive Brief — 1–2 pages, key findings only
- Standard Report — 9–15 pages, balanced depth. Right for most research tasks
- Deep Dive — 20+ pages, exhaustive analysis. Use when findings need to be fully defensible
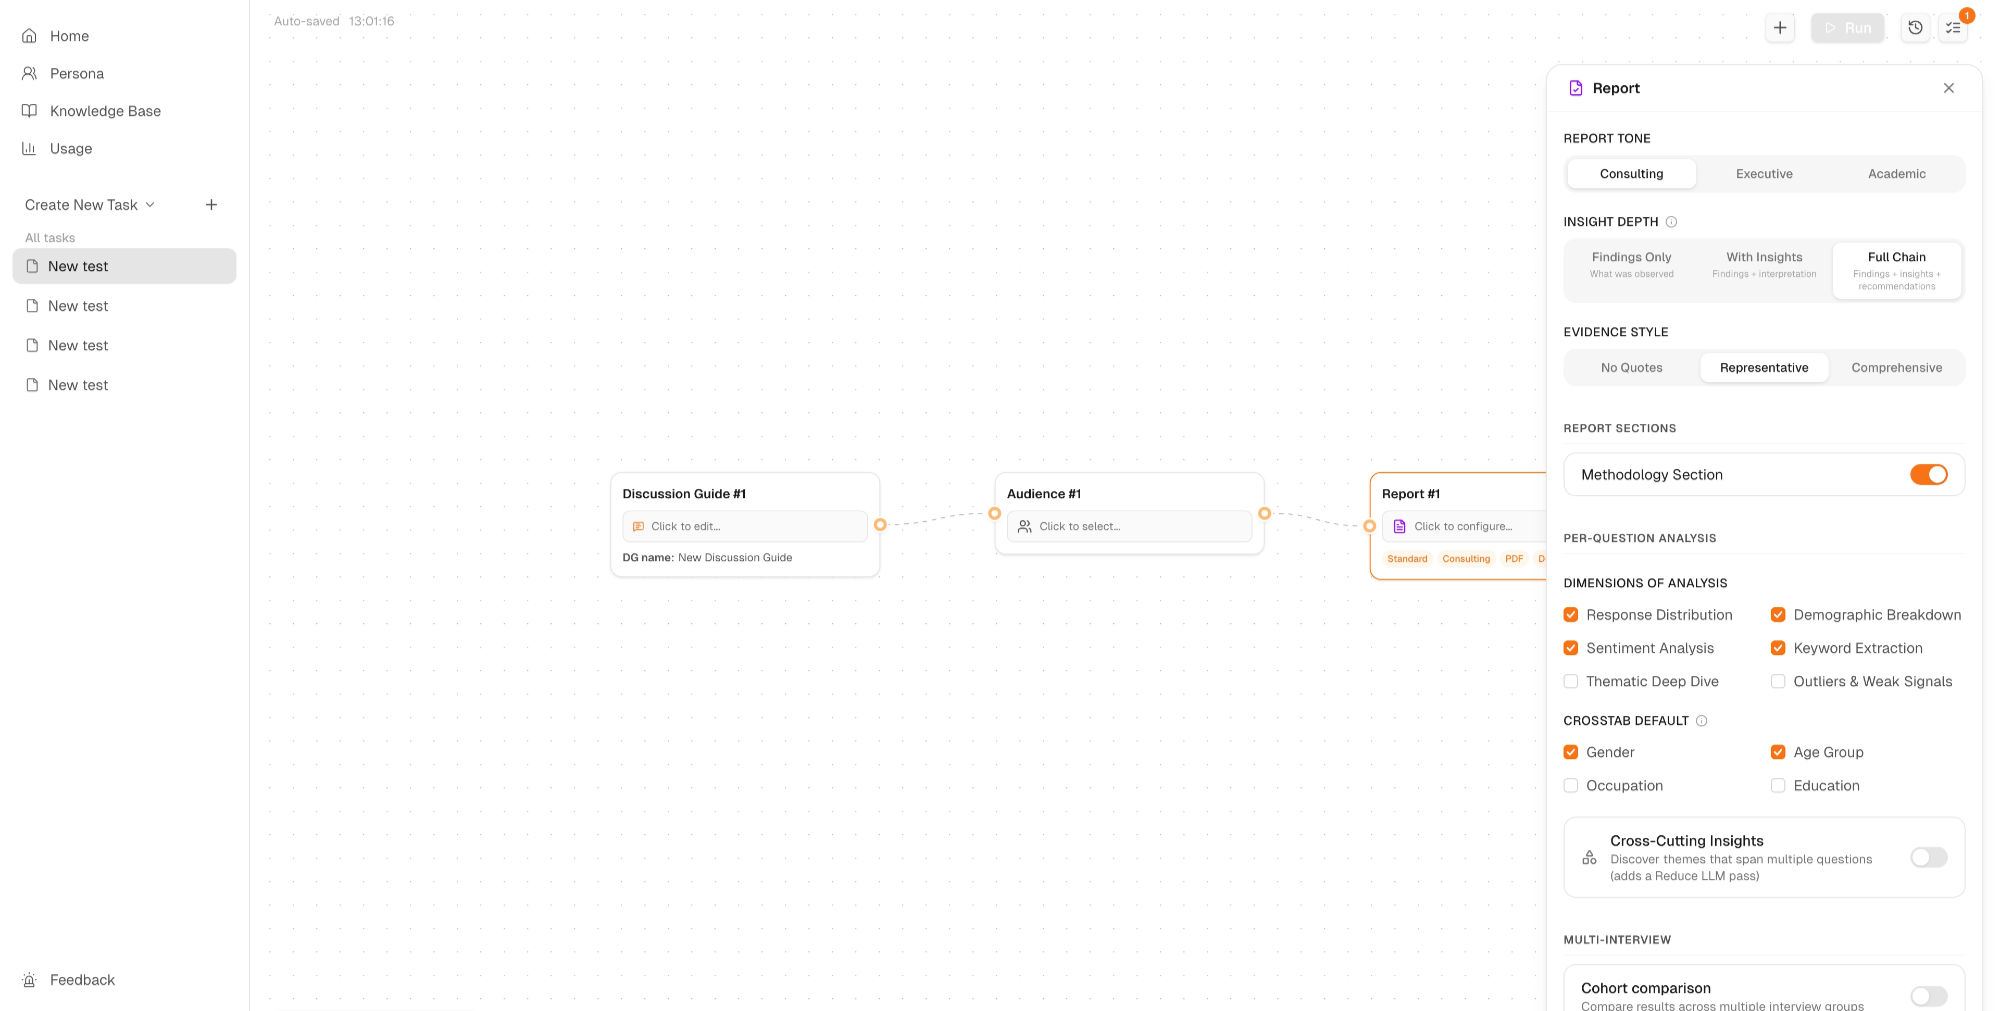
Report Tone
- Consulting — direct and decision-oriented. Best for internal teams acting on findings
- Executive — polished and high-level. Best for leadership or external stakeholders
- Academic — rigorous and methodological. Best when the research process needs to be documented
Insight Depth
- Findings Only — what was observed
- With Insights — findings + interpretation
- Full Chain — findings + insights + recommendations. Use when you need to know not just what happened, but what to do about it
Evidence Style
- No Quotes — conclusions only
- Representative — the most illustrative responses
- Comprehensive — full evidence set. Use when the exact language individuals use matters as much as the finding
Dimensions of Analysis
- Response Distribution — how answers spread across the group
- Sentiment Analysis — emotional valence across individuals
- Demographic Breakdown — how responses vary by profile and background
- Keyword Extraction — recurring language and framing patterns
- Thematic Deep Dive — deeper pattern analysis across responses
- Outliers & Weak Signals — minority responses that may indicate emerging patterns
Crosstab Default Cross-tabulate by Gender, Age Group, Occupation, or Education to surface segmentation differences.
Cross-Cutting Insights Discover themes that span multiple questions. Note: this adds a Reduce LLM pass and increases generation time.
Methodology Section Toggle on if sharing results externally or with stakeholders unfamiliar with synthetic research.
Quick Test Report
Use this when you're testing content — ads, emails, landing page copy, social posts — and need fast, structured feedback rather than deep qualitative analysis. Best paired with Post / Email in the Content Node.
Quick Test Reports are designed to be scanned, not studied. They tell you whether your content is working, not everything you need to know about why. Use them to eliminate bad options quickly, then run a Research Report on the directions worth pursuing.
To configure your Quick Test Node:
Dimensions tab
Golden Four (Recommended for Every Test)
- Appeal / Likeability — how much the audience likes the content (5-point Likert)
- Comprehension / Clarity — how clearly the core message is understood (5-point Likert)
- Purchase / Action Intent — likelihood the audience takes the desired action (5-point)
- Brand Recall / Linkage — whether the brand is remembered and linked correctly (Yes / No)
Always Emitted
- Message Takeaway (open-ended) — required. Surfaces themed responses about what individuals actually took away from the content. This is the qualitative layer underneath the Likert scores.
Advanced Dimensions
7 additional dimensions available for more specific content testing needs.
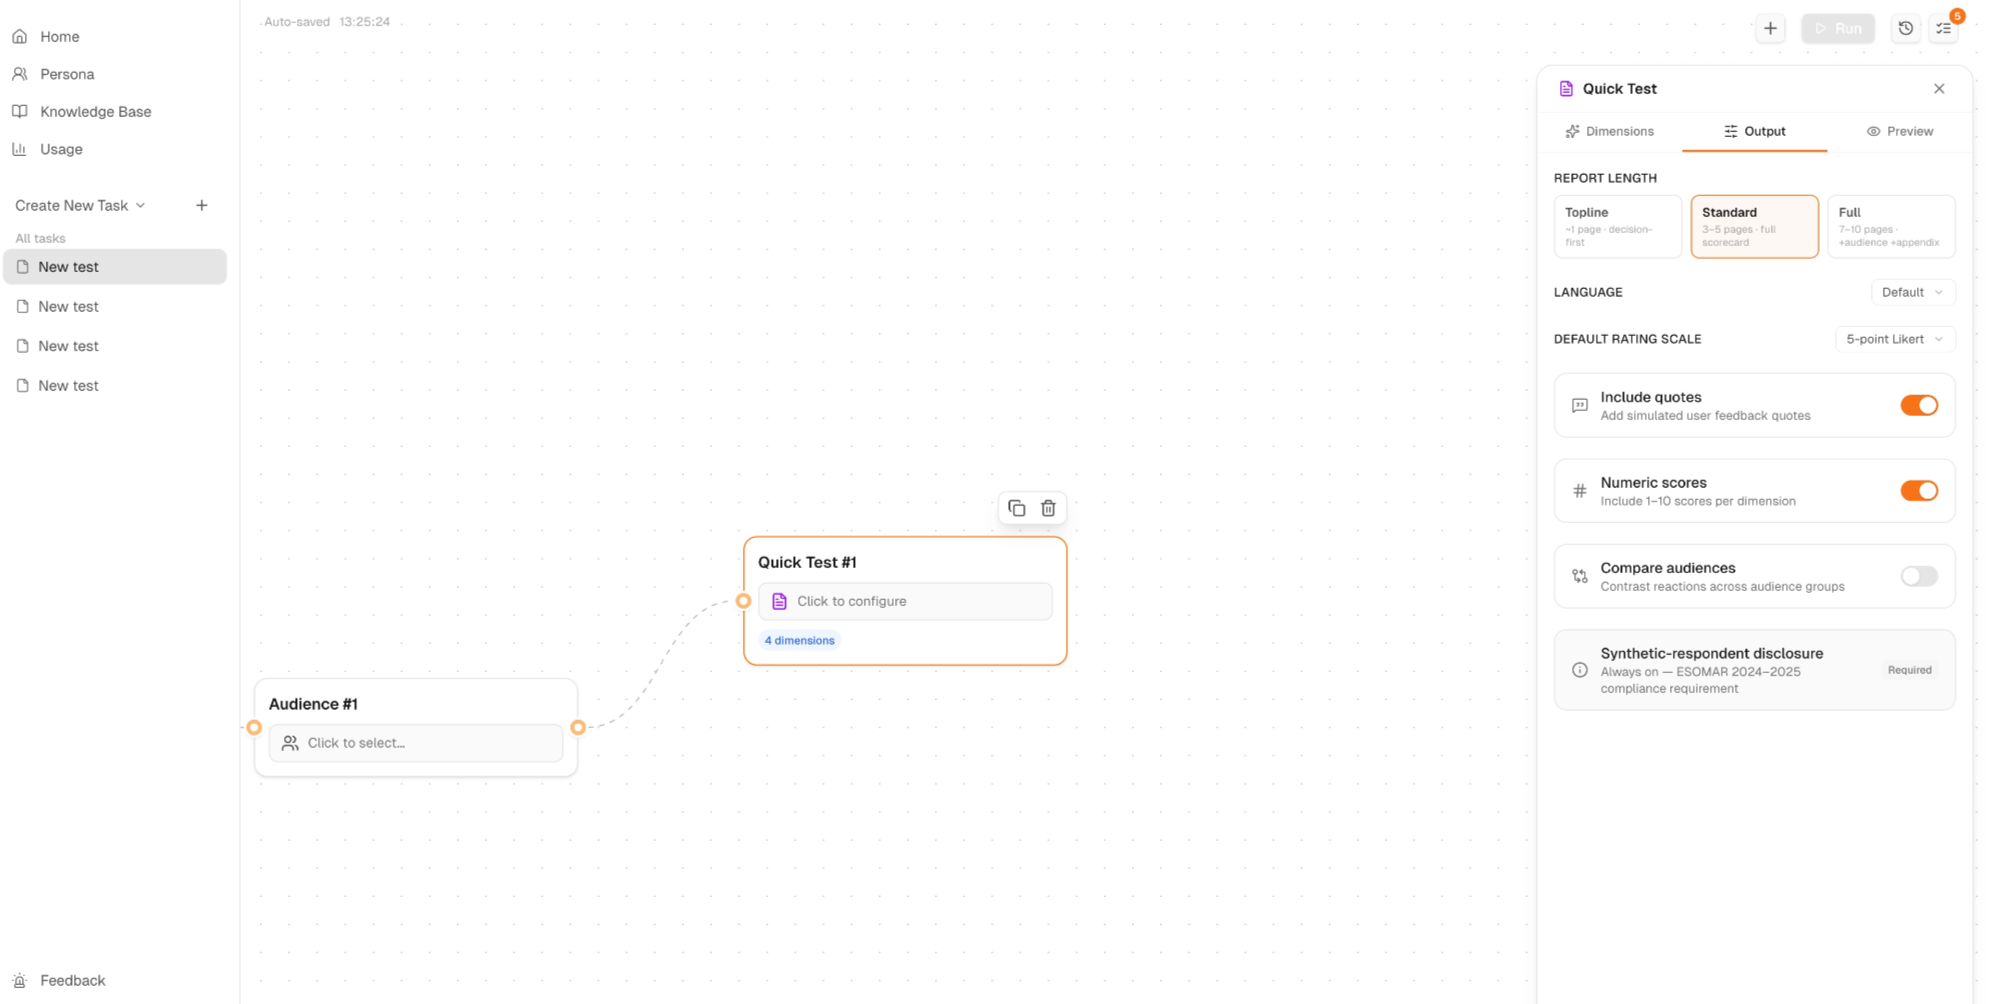
Output tab
Report Length
- Topline — 1 page, decision-first. Use when you need a single clear verdict fast
- Standard — 3–5 pages, full scorecard. The right choice for most content tests
- Full — 7–10 pages, audience and appendix included. Use when you need to share findings with stakeholders or compare across audience groups
Language — Default follows your Discussion Guide language
Default Rating Scale — 5-point Likert
Additional options:
- Include Quotes — adds simulated user feedback quotes to support findings. On by default
- Numeric Scores — includes 1–10 scores per dimension. On by default
- Compare Audiences — contrasts reactions across audience groups. Toggle on if running a multi-flow task with different segments
- Synthetic-respondent Disclosure — always on. Required for ESOMAR 2024–2025 compliance
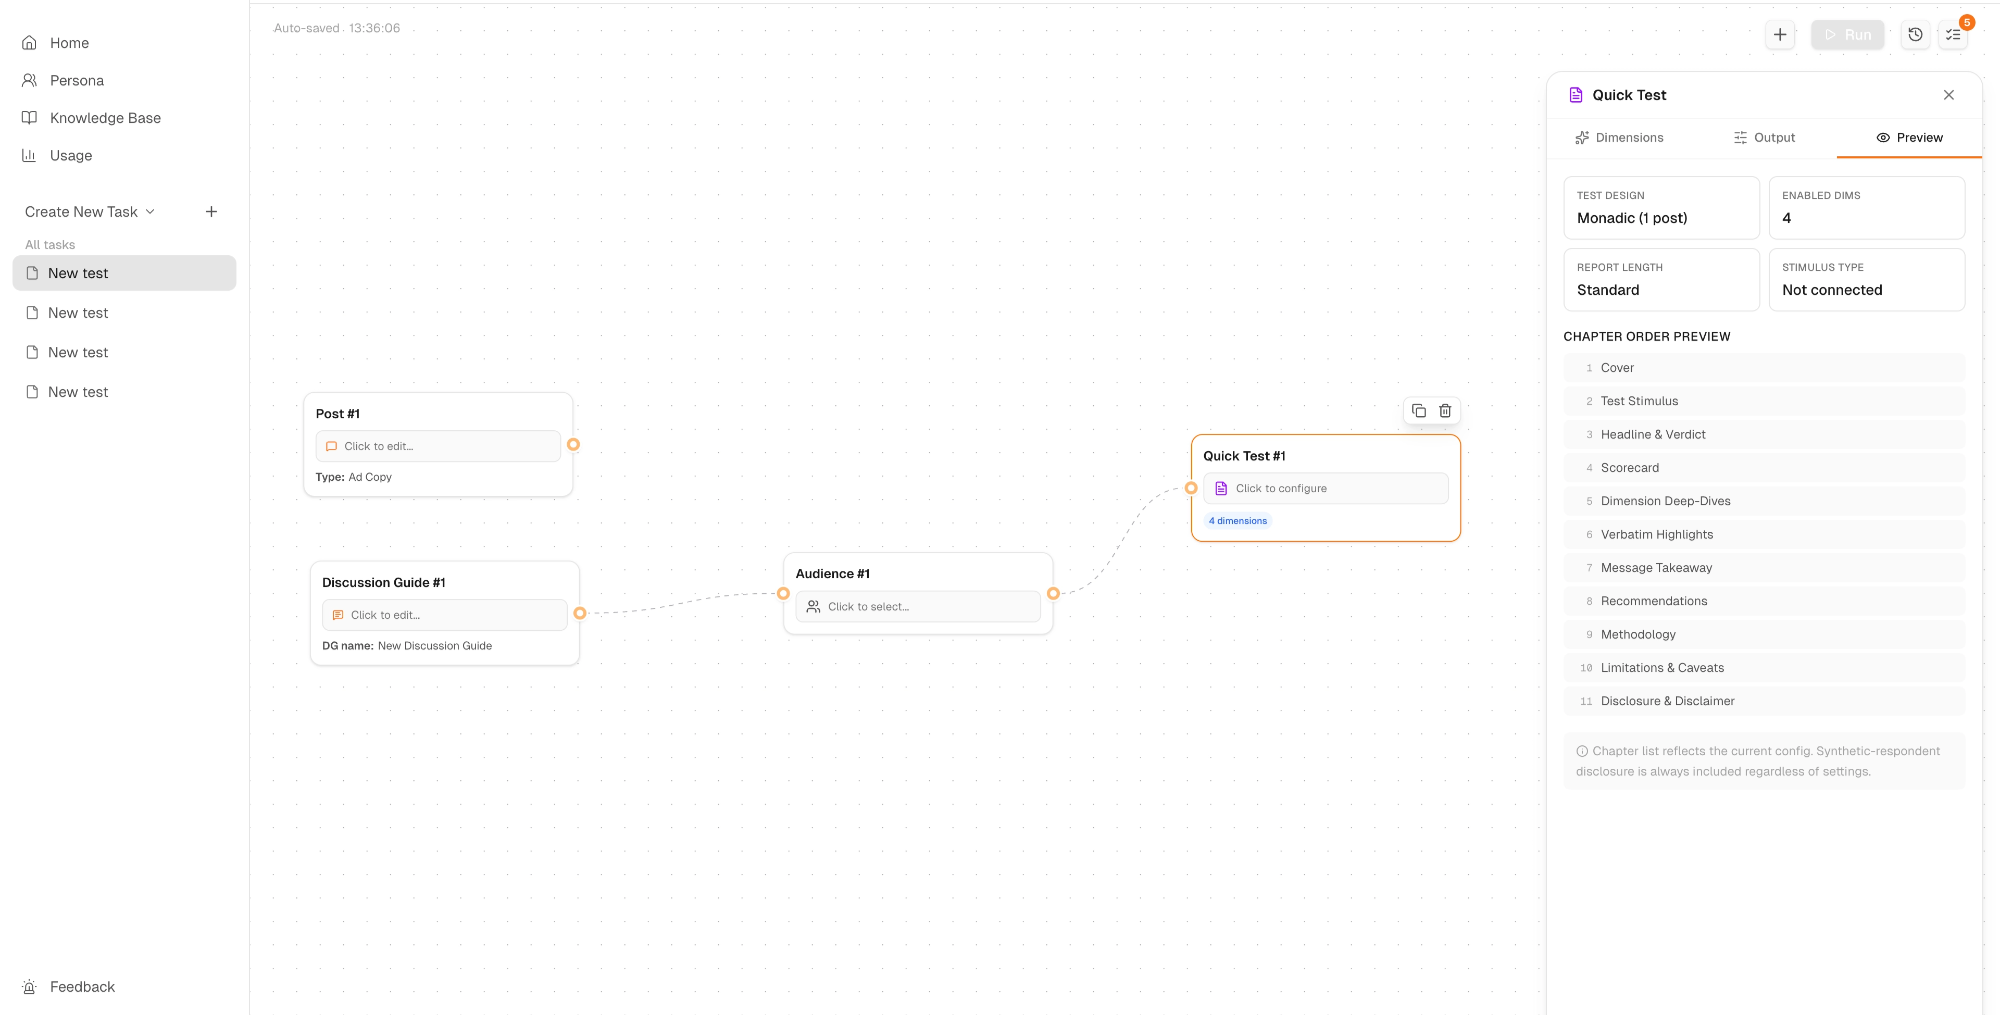
Preview tab
Shows the Chapter Order Preview based on your current configuration:
- Cover
- Test Stimulus
- Headline & Verdict
- Scorecard
- Dimension Deep-Dives
- Verbatim Highlights
- Message Takeaway
- Recommendations
- Methodology
- Limitations & Caveats
- Disclosure & Disclaimer
The chapter list updates in real time as you adjust your settings. Synthetic-respondent disclosure is always included regardless of configuration.