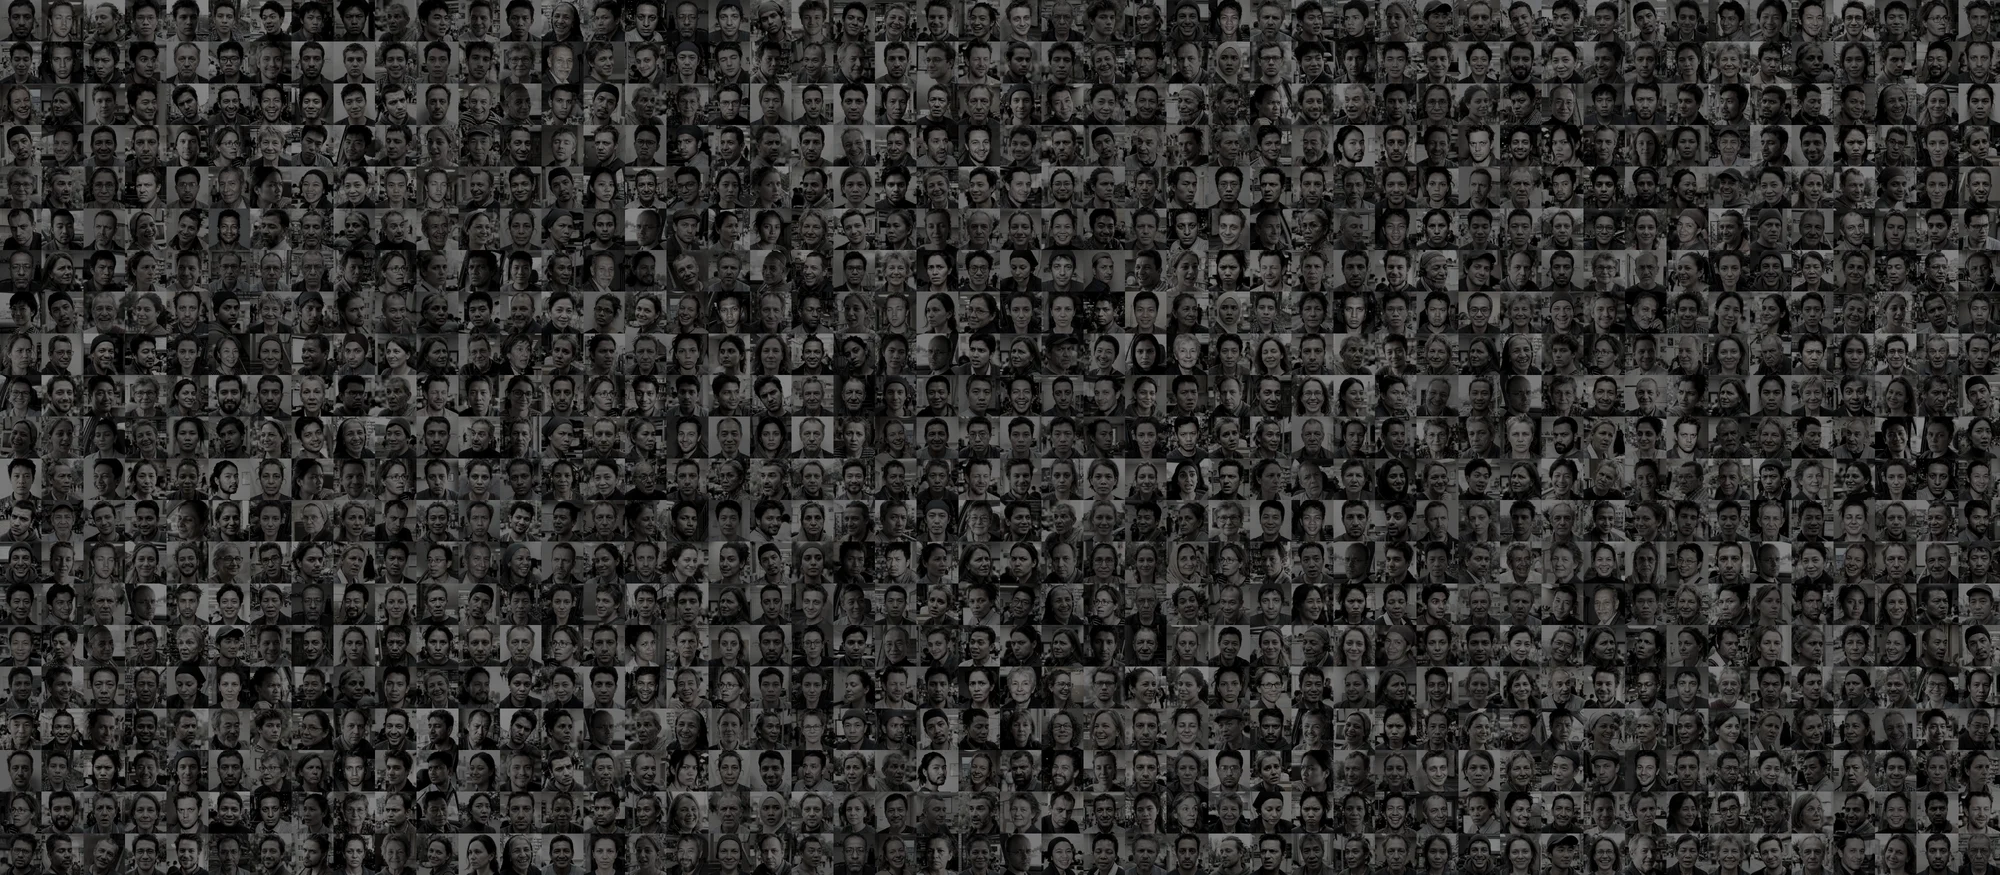
Simulating the world with 5.4 billion synthetic audience
Fifty-nine markets, each built from its own census and kept calibrated against real survey waves. Describe any audience in a sentence and it is ready the same day, in the language it speaks.
For a century only the largest brands could ask what real people think. Now any team can ask 5.4 billion simulated people, calibrated against real human data, and trust the answer.
A niche or international segment means a panel vendor
- Week 0Find a vendor with reach in the market. Negotiate incidence and price.
- Week 3Recruitment stalls on the hard segment. Quotas get relaxed.
- Week 6A sample you cannot re-contact, in a language you translated twice.
Describe the segment. It exists by the afternoon.
A simulator is only as good as
its calibration loop.
A prompt gives you an average voice frozen at training time. The foundation is rebuilt and re-scored as the world moves.
- The census sets the shape
Age, income, education, region, household. Each market is rebuilt from its own official statistics as new releases land, down to states and prefectures.
- Real answers keep it honest
Tens of thousands of real survey measurements are on record across markets. Where a real answer exists it grounds the simulated one; nearby topics calibrate the rest.
- Real people close the loop
Recurring real-people interview waves and fresh behavioral and macro data re-calibrate attitudes between census years.
- Scored in public
Every calibration wave is measured on the open benchmark, blind and reproducible, before it ships.
A 6% group is 6% of the audience, and it answers like itself.
Because the foundation is a census, minorities are not rounded away. Cross-tabs by age, region or income come out of the same population the country reports.
The read below is the Japan slice of an Asia-Pacific snack study: over-55s are the group that says no, and they are exactly as large as they are in the country.
| 18–34 | 35–54 | 55+ | |
|---|---|---|---|
| Yes | 47% | 31% | 14% |
| Maybe | 33% | 39% | 28% |
| No | 20% | 30% | 58% |
Hit cell: the answer the question was really about. Where a real survey measurement exists it grounds the cell, and every cell opens into the people behind it.
Premium audiences, maintained by iMario.
Built once on the foundation, calibrated continuously against real survey waves, ready the moment you need them. Your own audiences start from the same place.
Census joint distributions plus each market’s national attitude surveys.
Category, brand and purchase measurements on record.
Calibrated on real developer survey waves.
Firmographic frames plus real B2B survey data.
Practice and specialty survey data.
Calibrated on ANES and Pew survey waves.
Coverage grows with every calibration wave.
59 markets, by region.
Each market is built from its own statistical office and national surveys. Every audience carries the sources it was built from.
- United States
- Canada
- Brazil
- Mexico
- Argentina
- and 1 more
- United Kingdom
- Germany
- France
- Spain
- Italy
- and 28 more
- United Arab Emirates
- Saudi Arabia
- South Africa
- Egypt
- and 4 more
- China
- Japan
- South Korea
- India
- Indonesia
- and 7 more
markets, each built from its own official census and survey statistics.
people in the simulated foundation.
agreement with real survey distributions across 11 benchmarked markets, against a 93% repeat-survey ceiling.
Sources · iMario Synthetic Audience Benchmark, public method and raw files · Pew Research Center, survey methodology · National statistical offices and national attitude surveys · Updated 2026-08-30, reviewed by iMario research
59 markets across the Americas, Europe, the Middle East and Africa, and Asia Pacific, including the US, Canada, the UK and EU, China, Japan, Korea, India, Southeast Asia, Brazil, Australia and the Gulf. Each market carries the sources it was built from, in the app.